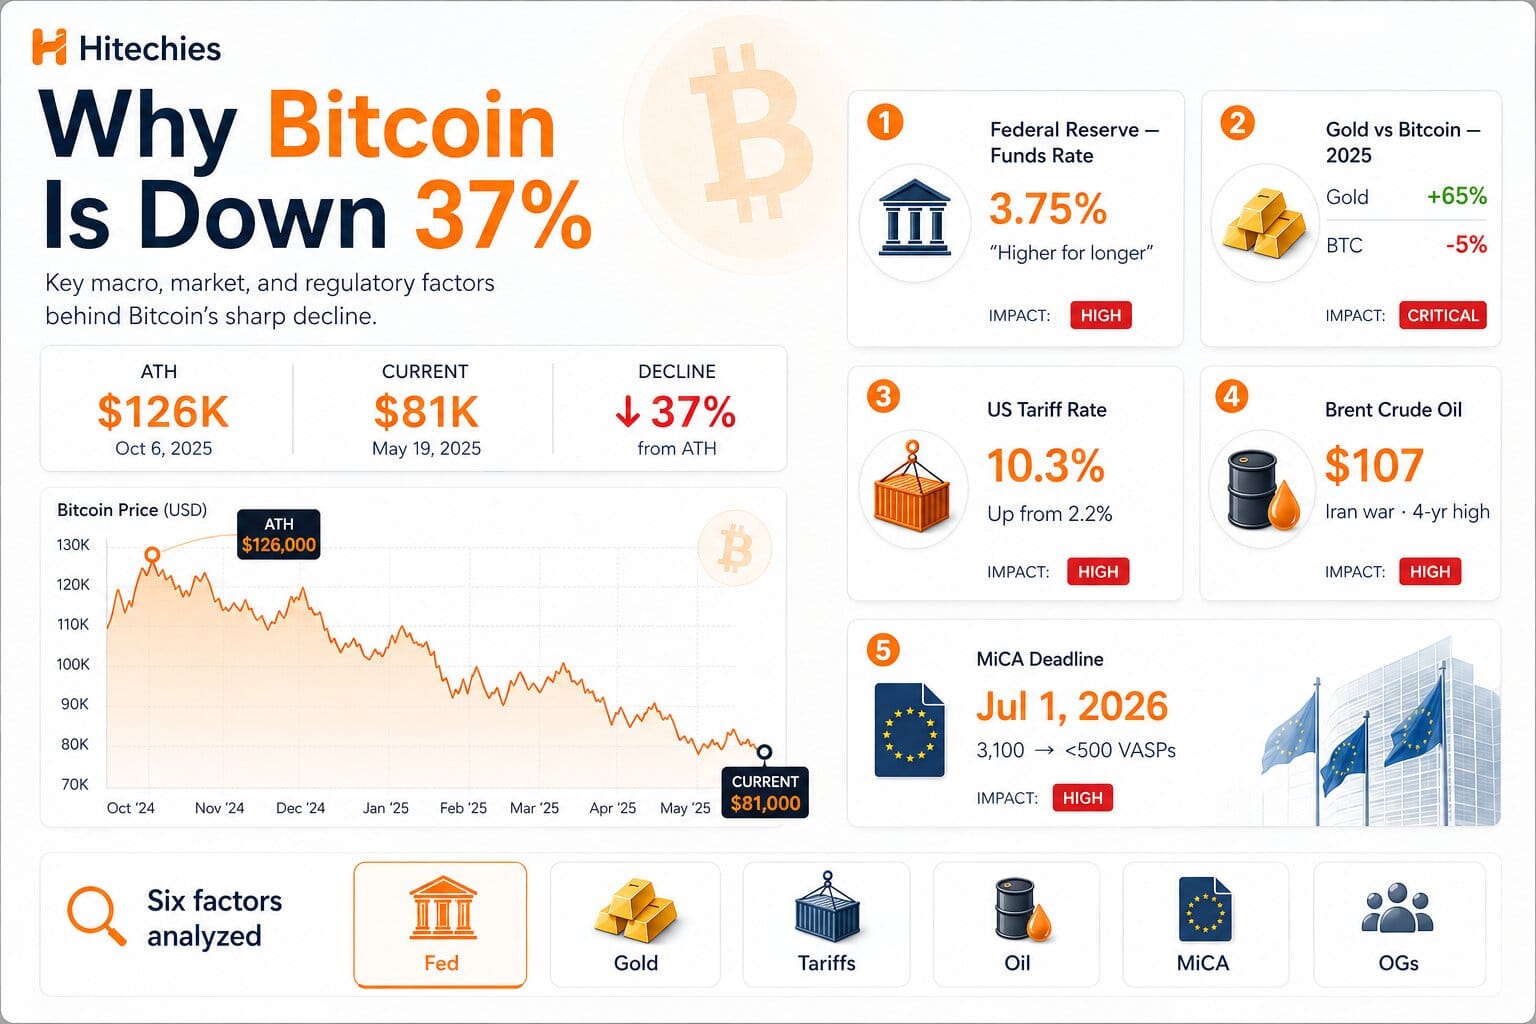
Why Bitcoin Is Down 37% From Its ATH — Hitechies.Bitcoin hit an all-time high of $126,198 in October 2025. Today it's trading around $81,000 — a 37% drop from its peak. This isn't a single story. It's six overlapping ones, and understanding all of them is the only way to make sense of where things stand.
The lazy explanation is "crypto is volatile, it crashes sometimes." That's true but useless. The more interesting question is: why now, why this deep, and why is gold doing the exact opposite? The answer involves the Federal Reserve, a US-China trade war, a Middle East conflict affecting oil prices, European regulatory overhaul, long-term holder distribution, and a structural question about what Bitcoin actually is — inflation hedge or risk asset.
Let's go through each one properly.
BTC / USD · Current snapshot~$81,000Down 37% from ATH of $126,198 (Oct 6, 2025)From ATH-37%Gold YTD 2026+7%BTC YTD 2026-14%Fed rate3.5–3.75%
📊 Six factors pulling Bitcoin down simultaneously
Macro + structural
No single event explains Bitcoin's decline from $126K to $81K. It's a convergence — six independent pressure systems hitting at the same time. Here's the overview before we go deep on each one.
🏦MonetaryFed Funds Rate3.75%Higher for longer — 4 dissenting FOMC votes0%Impact: High5%🥇Store of valueBTC vs Gold (2025)−40%Gold +65%, BTC −5% in the same yearNarrativeImpact: Critical⚖️Trade warUS Avg Tariff Rate10.3%Up from 2.2% — $1,100 cost per household2.2%Impact: High15%🛢️GeopoliticsBrent Crude Oil$107/bblIran war premium — 4-year high$60Impact: High$130📜RegulationMiCA Hard DeadlineJul 1, 20263,100 → fewer than 500 licensed VASPsDec 2024Impact: MediumJul 2026🐳On-chainOG Holder Distribution$19BOct 2025 liquidation — persistent overhangResolvingImpact: Med–HighBTC price vs. Gold — indexed to 100 (Aug 2025 = 100)
🏦 Factor 1 — The Federal Reserve and the liquidity trap
Monetary policy
Bitcoin doesn't trade in a vacuum. Research from CoinShares published in early 2026 put it bluntly: Bitcoin tracks the Fed's balance sheet. When the Fed expands credit — quantitative easing, rate cuts, balance sheet growth — Bitcoin rises. When the Fed tightens, Bitcoin falls. Not because of anything crypto-specific, but because Bitcoin is a liquidity-sensitive risk asset that behaves like high-beta tech in a tightening cycle.
In 2025, the Fed reduced its balance sheet while simultaneously cutting rates six times since September 2024 — a contradictory stance that left markets confused about the actual direction of policy. By early 2026, the Fed held rates at 3.5–3.75%, and the most recent FOMC meeting produced four dissenting votes — the most since 1992 — with members disagreeing in opposite directions simultaneously. Half wanted to cut faster. Half wanted to stay put or tighten. That level of internal division is itself a market signal: the Fed doesn't know what comes next either.
The stagflation problem The Fed is caught between two bad options. Inflation is stuck around 3.3% (March 2026 CPI), above target but not crisis-level. Meanwhile, unemployment is rising from cycle lows and consumer delinquency rates hit 4.8% of outstanding household debt in Q4 2025 — the highest since 2017. Cut rates too fast and inflation resurges. Hold rates high and risk a consumer-led recession. In either scenario, the "cheap money era" that powered Bitcoin's 2024–2025 bull run is not returning any time soon. Powell's chairmanship ends May 15, 2026, and his likely successor Kevin Warsh favors tighter policy — which markets are already pricing in.Fed funds rate vs. Bitcoin price (2023–2026)
🥇 Factor 2 — Gold is winning the "digital gold" argument right now
Store of value
The "Bitcoin is digital gold" thesis has been Bitcoin's most powerful narrative for years. In 2025, it broke down spectacularly. Gold rocketed 65% in 2025. Bitcoin ended the year down 5% against the dollar and down roughly 40% against gold itself.
This isn't random. It reveals something fundamental about what the two assets actually are in a crisis. Gold is the first-responder hedge — it's held by central banks, sovereign wealth funds, and institutional investors with mandates that explicitly include gold as a crisis allocation. When geopolitical risk spikes, gold gets automatic inflows from players who can't hold Bitcoin and who don't need to think twice about it.
Bitcoin, by contrast, still has to earn its place in every new crisis. It's not on most institutional mandate lists as a crisis hedge. It's often held by leveraged retail traders who sell risk assets when they get scared. The result: in the same environment where gold soared — expanding US debt ($38.5 trillion national debt, $1.8 trillion fiscal year 2025 deficit), dollar weakening, geopolitical tension — Bitcoin sold off.
The CoinShares finding that matters Bitcoin's BTC-to-Gold ratio fell roughly 30% since August 2025. Bitcoin's correlation with Gold reached approximately 0.85, near a record high — yet Bitcoin still underperformed dramatically. The reason: Gold responds to sovereign demand and geopolitical stress. Bitcoin responds to credit availability and retail risk appetite. They're correlated in direction but not in magnitude when crisis hits.Asset performance comparison 2025 (%)
The longer-term picture isn't damning for Bitcoin — over five years it still vastly outperforms gold. But over the specific 12-month period when fiat debasement fears were highest, gold won decisively. That's a data point worth sitting with.
⚖️ Factor 3 — The US-China trade war and the tariff liquidity paradox
Trade policy
The US raised average effective import tariffs from 2.2% to 10.3% by early 2026 — the most aggressive tariff campaign since the Smoot-Hawley era. The average US household is paying roughly $1,100 more per year as a direct result. China responded by cutting US goods imports by 26% in 2025.
In theory, this environment should have been rocket fuel for Bitcoin. Tariffs are inflationary. The dollar was weakening. Geopolitical risk was elevated. These are precisely the conditions Bitcoin advocates have spent years insisting would validate the "inflation hedge" thesis. Instead, Bitcoin dropped 47% from its October ATH during this period.
The tariff-liquidity paradox explained Tariffs force the Fed to hold rates higher to fight tariff-induced inflation. Higher rates tighten financial conditions. Tighter financial conditions reduce risk appetite. Reduced risk appetite means institutional outflows from Bitcoin ETFs — sometimes hundreds of millions in a single day. The very thing that should make Bitcoin more attractive (inflation fear) simultaneously makes the financial environment that supports Bitcoin less supportive. It's a trap. Bitcoin wants loose money and inflation fear simultaneously. Right now it's getting tight money and inflation fear.
There's a second-order effect on Bitcoin mining that's underappreciated. ASIC mining hardware is manufactured predominantly in China. US tariffs on Chinese electronics have increased mining hardware costs significantly, pressuring miners' margins. Post-halving, miners are already receiving 50% less BTC per block than before April 2024. Squeezed margins plus cheaper hardware-to-AI conversion is leading some mining companies to liquidate BTC holdings to fund data center pivots. That's systematic selling pressure from a group that would historically be holders.
US effective tariff rate vs Bitcoin price drawdown (2025–2026)
🛢️ Factor 4 — The Iran war, oil at $107, and the petrodollar fracture
Geopolitics
The US-Iran conflict that began February 28, 2026 pushed Brent crude to $107 per barrel — a four-year high — and introduced a new variable into global financial markets: the potential disruption of the Strait of Hormuz, through which roughly 20% of global oil trade flows. This is not a normal geopolitical risk event. It's an energy supply risk event, and those hit differently.
Oil at $107 means inflation doesn't fall. Inflation not falling means the Fed can't cut. Fed not cutting means no liquidity. No liquidity means Bitcoin stays under pressure. The chain of causation is direct and brutal.
The petrodollar dimension Something more structural is happening underneath the oil story. The UAE has been seeking dollar swap lines. OPEC cohesion is fracturing. The dollar's share of global reserve holdings has fallen to roughly 57% — a 25-year low. The system that has anchored global trade settlement since 1971 is showing genuine stress for the first time. This is, theoretically, the single most Bitcoin-bullish macro development imaginable. A scarce, non-sovereign, non-political monetary asset becomes more attractive precisely when sovereign currency systems show structural weakness. Yet Bitcoin is still down. The tension between this long-term structural positive and the short-term liquidity negative is the central contradiction defining 2026 Bitcoin.
There is one genuinely new data point from the Iran conflict that's worth noting: since February 28, Bitcoin has actually outperformed both the S&P 500 and gold during the war period — up roughly 20% from where it was when the conflict began. This is the first time Bitcoin has beaten every traditional safe haven during a major geopolitical event. Institutional ETF holders with long time horizons are not liquidating on headlines the way retail-dominated markets did in earlier cycles. That's a structural change worth tracking.
📜 Factor 5 — MiCA and the European compliance crunch
Regulation
The EU's Markets in Crypto-Assets Regulation (MiCA) fully applied from December 30, 2024, with a transitional grandfathering period running until July 1, 2026 — after which unlicensed crypto service providers must cease EU operations entirely. No further grace periods. ESMA has been explicit about this.
The compliance crunch is real and happening now. As of 2026, fewer than 70 companies hold full MiCA licenses. The total number of active Virtual Asset Service Providers in Europe peaked at around 3,100 in early 2025, then fell sharply. By 2026, fewer than 500 unlicensed VASPs are expected to remain active. That's a 95% reduction in the number of active crypto service providers in Europe's market.
EU crypto service providers: licensed vs total active (2024–2026)The compliance cost problem MiCA licensing costs range from €50,000 to €150,000 depending on exchange size. Ongoing compliance costs for smaller firms are running up to 15% of revenue — compared to under 2% for large exchanges. This is accelerating market consolidation. The European crypto landscape is being restructured around a handful of well-capitalised players. DeFi platforms saw a 16% drop in EU usage. EU-based Bitcoin ATMs declined 35%. The short-term effect: liquidity fragmentation and reduced market participation in one of the world's largest economic blocs.
The longer-term picture is more complex. MiCA is bringing institutional legitimacy — over 30% of EU institutional investors increased crypto exposure following MiCA's implementation, and retail participation grew 27% on regulated platforms. The regulation is doing exactly what regulation is supposed to do: forcing out bad actors while creating infrastructure for serious money to enter. But the transition period itself is painful and disruptive, and that disruption is showing up in 2026 price action.
Short-term MiCA pain 3,100 → fewer than 500 active VASPs. Compliance costs up to 15% of revenue for small firms. DeFi down 16% in EU. Bitcoin ATMs down 35%. Liquidity fragmentation across member states during transition.Long-term MiCA gain 30% more EU institutional crypto exposure. Retail participation up 27% on regulated platforms. Crypto fraud in EU down 60%. Foundation for serious institutional capital that couldn't enter before.
🐳 Factor 6 — Long-term holders distributed at $100K, and the damage lingered
On-chain structure
Perhaps the most underappreciated factor in Bitcoin's decline is what happened on-chain as price crossed $100,000. Analysts David Brickell and Chris Mills of the London Crypto Club documented it precisely: "We've seen substantial selling from long-term 'OG' holders who, having held through multiple cycles, began distributing aggressively around the psychologically important $100,000 level."
These aren't panicked retail sellers. These are Bitcoin holders who bought at $1, $10, $100, and $1,000 — people sitting on life-changing returns who had always said "I'll sell some at $100K." They followed through. The result was price-insensitive selling pressure that arrived exactly when momentum buyers expected a breakout above $100K, creating a psychological ceiling that the market has struggled to recover from.
A second structural factor compounded this: Bitcoin's four-year cycle has become self-defeating. Traders who believe in the cycle now try to front-run each other to exit before the cycle top. This accelerates the top's arrival and deepens the subsequent correction. The October 2025 peak and subsequent $19 billion liquidation event — which alone wiped out over $100 billion from total crypto market cap in days — left a persistent overhang. Liquidity providers who absorbed that forced selling appear to have steadily reduced exposure afterward, creating structural weakness that persisted into 2026.
Bitcoin supply by holding period — long-term holders as % of supplyThe miner dynamic Post-April 2024 halving, miners receive 3.125 BTC per block — half of what they earned before. With Bitcoin at $81K instead of $126K, miner revenue per block has dropped from roughly $394 at the ATH to around $253 today. Some mining operations are pivoting to AI infrastructure (data centers, GPU compute) and selling Bitcoin to fund the transition. This creates systematic selling from a group that has historically been a structural holder.
📅 How it unfolded — the timeline of the decline
Oct 2025 → May 2026Oct
2025
ATH: $126,198 — October 6, 2025
Bitcoin peaks. Long-term holder distribution accelerates at and above $100K. The October liquidation event alone destroys $19 billion in leveraged positions and $100B+ in total market cap. Liquidity providers quietly reduce exposure.
Nov–Dec
2025
Post-peak selloff — Bitcoin falls to $85,000
Bank of Japan rate hike expectations unwind the yen carry trade. Over $200M in leveraged longs liquidated in hours. Bitcoin ends 2025 down 5% vs USD, down ~40% vs gold. The "digital gold" narrative faces its most serious empirical challenge.
Jan
2026
Brief stabilisation — BTC recovers to $94,000
Bitcoin consolidates post-crash. ETF inflows return during periods of price strength. Regulatory optimism around proposed US crypto legislation briefly lifts sentiment. The market looks like it might be finding a floor.
Feb–Mar
2026
Trade war escalation — Bitcoin drops back below $80,000
US tariff average hits 10.3%. Every new tariff announcement reprices the Fed timeline downward. March 2026 CPI comes in at 3.3% — hotter than expected. Rate cut expectations pushed further out. Bitcoin sells off each time the Fed timeline moves.
Feb 28
2026
US-Iran conflict begins — oil spikes to $107
The Strait of Hormuz closure threat adds energy inflation risk on top of tariff inflation. The Fed is now trapped: geopolitical energy shock plus trade war tariffs plus sticky CPI equals no rate cuts. Gold surges. Bitcoin initially drops, then recovers as institutional holders hold firm.
Apr–May
2026
Current — BTC consolidating around $78K–$81K
Iran peace signals emerge. Brent crude falls from peak. Bitcoin recovering — up ~20% since the war began, outperforming both gold and S&P 500 during this specific period. The $80K resistance level is the key technical test. A clean monthly close above $82K (200-day moving average) is the signal most analysts are watching.
🔭 What actually needs to change for Bitcoin to recover
Forward looking
The structural case for Bitcoin hasn't changed. Fixed supply. Post-halving scarcity. Growing institutional infrastructure. A world where sovereign currency systems are under visible stress. The US Strategic Bitcoin Reserve established in 2025 is an unprecedented institutional safety net. MicroStrategy holds over 713,000 BTC. ETF cumulative inflows have exceeded $60 billion.
None of that is sufficient to overcome the specific macro headwinds in play right now. Here's what actually needs to shift:
Fed
The Fed needs to signal genuine rate cuts, not just pause
Policy markets currently price better than two-thirds odds of at least two cuts by year-end 2026. If tariff disinflation (lower consumer demand → falling prices) gives the Fed cover to cut, crypto markets will be the first to react. The July 24, 2026 expiry of Section 122 tariffs creates a binary event that could be the catalyst.
Oil
Iran de-escalation needs to stick
Brent has already fallen from $107 toward $107 on peace signals. A sustained drop in oil prices removes the key energy inflation risk keeping the Fed hawkish. Bitcoin has historically rallied sharply on geopolitical de-escalation events — a pattern already showing in April–May 2026 data.
MiCA
July 1 MiCA deadline passes without market disruption
The compliance crunch peaks before July 1. If the EU market consolidates cleanly — with licensed players absorbing the volumes of exiting unlicensed ones — the disruption ends and the longer-term institutional infrastructure benefits begin showing up in price action.
Chart
Clean monthly close above $82,000
The 200-day moving average sits around $82,000. A confirmed close above this level is the technical signal that most institutional frameworks use to confirm a recovery phase. Below it, the market remains in a corrective structure. Above it, the $92K–$98K zone opens based on current chart structure.
The constructive base case If tariffs disinflate by Q3, the Fed cuts twice, and Iran de-escalation holds, the institutional consensus clusters around $120,000–$170,000 by end-2026. Standard Chartered and Bernstein revised targets still put year-end 2026 consensus at $150,000. The structural foundation — ETFs, halving supply dynamics, dollar weakness, de-dollarisation — is intact. The question is purely timing and sequencing of macro catalysts.
Track BTC in Satoshis — less emotionally loaded → Sometimes seeing 0.001 BTC instead of "$81 worth" changes how you think about volatility. Free tool, no signup, no opinions.